
RESEARCH ARTICLE
Towards Early Intervention: Detecting Parkinson's Disease through Voice Analysis with Machine Learning
K.P. Swain1, S. R. Samal2, Vinayakumar Ravi6, *, Soumya Ranjan Nayak3, Tahani Jaser Alahmadi7, *, Prabhishek Singh4, Manoj Diwakar5
Article Information

Identifiers and Pagination:
Year: 2024Volume: 18
E-location ID: e18741207294056
Publisher ID: e18741207294056
DOI: 10.2174/0118741207294056240322075602
Article History:
Received Date: 02/01/2024Revision Received Date: 24/02/2024
Acceptance Date: 11/03/2024
Electronic publication date: 30/04/2024
Collection year: 2024

open-access license: This is an open access article distributed under the terms of the Creative Commons Attribution 4.0 International Public License (CC-BY 4.0), a copy of which is available at: https://creativecommons.org/licenses/by/4.0/legalcode. This license permits unrestricted use, distribution, and reproduction in any medium, provided the original author and source are credited.
Abstract
Introduction/ Background
This study aims to utilize machine learning algorithms for early detection of Parkinson's Disease (PD) through voice recording analysis. Employing advanced machine learning techniques and a comprehensive dataset of voice samples, the objective is to develop a non-invasive, accurate, and reliable method for PD diagnosis, contributing to early intervention and management of the disease.
Parkinson's Disease (PD) is a prevalent neurodegenerative disorder impacting millions globally. Early and accurate diagnosis is crucial for effective management and treatment. This study leverages Machine Learning (ML) algorithms to analyze voice recordings, aiming to improve PD detection.
Materials and Methods
We utilized a dataset of 195 voice samples with 23 attributes, applying machine learning algorithms such as Linear Discriminant Analysis (LDA), Support Vector Machine (SVM), K-Nearest Neighbors (KNN), and Convolutional Neural Networks (CNN). The dataset was preprocessed, balanced, and evaluated using various performance metrics.
Results
The K-Nearest Neighbors (KNN) model demonstrated superior performance, achieving high precision (0.96-1.00), recall (0.97-1.00), and F1-scores (0.98-0.99) for both PD and non-PD classes, demonstrating an overall accuracy of 0.98 across 59 samples. This showcases its effectiveness in PD detection via voice analysis.
Discussion
This research underscores the potential of ML in revolutionizing PD detection through non-invasive methods. By comparing various algorithms, the study not only identifies the most effective model but also contributes to the broader understanding of applying ML techniques in healthcare.
Conclusion
The study's findings advocate for the KNN model as a promising tool for early and accurate PD diagnosis through voice analysis. The success of this model opens avenues for future research, including the exploration of more advanced algorithms and the integration of these models into practical diagnostic applications.
1. INTRODUCTION
Parkinson's Disease (PD) is a neurodegenerative condition primarily impacting areas of the brain responsible for producing dopamine, with a particular emphasis on the substantia nigra. The symptoms typically develop slowly over the years. People afflicted by PD might exhibit resting tremors, frequently characterized as a pill-rolling motion in the hands. Other potential symptoms include bradykinesia, limb rigidity, and problems with gait and balance. The progression of these symptoms often varies between individuals due to the disease's diverse nature [1, 2]. An early sign of the disease could be stiffness or pain in the shoulder or hips. Some patients may also exhibit stooping, leaning, or slouching postures. PD is also linked to non-motor symptoms like indifference, depression, constipation, sleep disturbances, anosmia, and cognitive decline. Specific medicines, especially those used for pain, can cause symptoms akin to PD. Therefore, it's crucial to differentiate between the effects of medication and genuine PD symptoms [3, 4]. The exact cause of PD remains largely unknown, but current research is exploring potential biomarkers for early diagnosis and more tailored treatments [5]. While there's no cure, it's emphasized that complications from the disease can be serious, but the disease itself isn't fatal [6]. With proper medical care, individuals with PD can maintain a good quality of life. Recognizing early signs and seeking timely medical intervention is essential for better management of the disease.
Adding to the complexity of PD, it is recognized that the disease manifests in both rapidly and slowly progressing forms, illustrating the heterogeneous nature of PD. Treatment strategies for PD are comprehensive, encompassing pharmacologic methods primarily involving levodopa preparations, with or without additional medications. Nonpharmacologic approaches such as exercise, physical, occupational, and speech therapies play a crucial role in patient care. For individuals showing resistance to medication, experiencing worsening symptoms upon medication wear off, or suffering from dyskinesias, advanced interventions like deep brain stimulation and levodopa-carbidopa enteral suspension have been found beneficial. These insights underscore the importance of a personalized treatment plan, reflecting the tailored approach required in managing the broad spectrum of PD symptoms and their impact on patients' quality of life [7-11].
The objective of this study is to utilize machine learning algorithms to analyze voice recordings for early detection of Parkinson's disease. By leveraging a dataset compiled from individuals with voice disorders associated with Parkinson's, the aim is to develop a model capable of accurately identifying the presence of Parkinson's disease. This research seeks to contribute to early interventions and improved patient outcomes by providing a tool for early diagnosis and personalized treatment planning in Parkinson's disease management.
This study introduces novel methodologies for the detection of Parkinson's Disease using MDVP (Multidimensional Voice Program) audio data, marking a significant advancement over existing approaches. Firstly, we have developed an optimized preprocessing pipeline that significantly enhances the clarity and quality of voice recordings, improving the input data quality for machine learning models. Secondly, we introduced a hybrid machine learning model that combines the strengths of Linear Discriminant Analysis (LDA), Support Vector Machine (SVM), K-Nearest Neighbors (KNN), and Convolutional Neural Networks (CNN) to achieve higher accuracy and sensitivity in detecting Parkinson's Disease.
2. LITERATURE REVIEW
The article [12] emphasizes early, remote, and accurate Parkinson's Disease (PD) detection worldwide. It explores machine learning's role in telemedicine for early PD detection. In this, four ML models were trained on MDVP (Multidimensional Voice Program) audio data from 30 PD patients and healthy subjects. Random Forest emerged as the best technique, with 91.83% accuracy and 0.95 sensitivity. The study advocates ML in telemedicine, offering hope to PD patients. The research focuses [13] on non-motor symptoms like REM (Rapid Eye Movement) sleep behavior disorder and olfactory loss preceding motor symptoms. Here, machine learning models, including Boosted Logistic Regression, are implemented, which offers promising results for accurate prediction (97.159% accuracy, 98.9% ROC). In the research conducted [14], deep neural networks are utilized on the UCI (University of California, Irvine) Parkinson's Telemonitoring Voice Data Set to anticipate the extent of disease progression. The initial speech data is subjected to preprocessing involving standardization by signal error drop and feature categorization through the employment of the wavelet cleft fuzzy algorithm. Anomalies in features are identified using the firming bacteria foraging algorithm. Deep brooke inception net classifier achieves better accuracy (99.8%) in predicting Parkinson's severity, outperforming conventional methods and highlighting voice abnormality data's effectiveness. The research [15] implements the advancements in AI and ML to offer accurate medical diagnosis for incurable ailments like Parkinson’s Disease by implementing KNN, LR, RFC, and XGBC models on Oxford Parkinson's Disease Detection Dataset where XGBoost Classifier shows the highest accuracy (96.7%), precision (0.8571), recall (1.00), and F1-score (0.923), aiding doctors in diagnosing patients effectively.
The research [16] employs various Machine Learning (ML) and Deep Learning (DL) models, including SVM, RF, DT, KNN, and MLP, on voice signal features. Using the UCI dataset with techniques like SMOTE (synthetic minority over-sampling technique) and GridSearchCV, MLP achieves 98.31% accuracy, 98% recall, 100% precision, and 99% f1-score. SVM performs with 95% accuracy, 96% recall, 98% precision, and 97% f1-score. In the investigation outlined in [17], Machine Learning classifiers such as Decision Trees, Logistic Regression, and K-nearest neighbors are utilized. Their effectiveness is evaluated by contrasting them with Ensemble learning methods like Bagging, Random Forest, and Boosting. The primary objective is to diagnose Parkinson's disease through the analysis of voice features. Accuracies are compared, and relevant features are ranked for healthy vs. PD classification, focusing on dysphonia detection. The researchers use speech and gait analysis data in [18], applying AI and machine learning techniques like Histogram of Oriented Gradients for feature extraction. A Random Forest Classifier neural network predicts PD using patient datasets of drawings. The research [19] proposes a machine learning-based PD detection method, utilizing feature selection (Boruta, RFE, RF) and classification (gradient boosting, XGBoost, bagging, Extra Tree). Recursive feature elimination with bagging achieves 82.35% accuracy with minimal voice features for diagnosis. By leveraging ML technology and audio data [20], validates using XGBoost algorithm for accurate PD diagnosis. Here, XGBoost demonstrates higher accuracy than other algorithms in diagnosing PD from voice data. A summary of all the literature is given in Table 1.
3. PROBLEM STATEMENT
Parkinson's Disease (PD), a neurodegenerative disorder, impacts millions globally, leading to symptoms like tremors, stiffness, and voice disorders. Early detection is paramount for effective interventions and optimized patient care. Despite the pressing need, traditional diagnostic tools can be invasive, costly, or necessitate specialized equipment. Voice recordings, reflecting subtle PD-induced changes, emerge as a promising non-invasive diagnostic medium. This study harnesses machine learning to analyze voice recording features, distinguishing between PD patients and healthy controls. Drawing from a dataset of voice features, the study implements various machine learning algorithms, including Logistic Regression, Decision Tree, Random Forest, Support Vector Machine (SVM), K-Nearest Neighbors (KNN), Gaussian Naive Bayes, and Bernoulli Naive Bayes, aiming to identify patterns indicative of PD. The primary objective is not only high diagnostic accuracy but also the minimization of false classifications. By integrating these algorithms, the study endeavors to establish a reliable, non-invasive diagnostic tool for Parkinson's disease, bridging the gap between technological advancement and medical diagnosis.
Additionally, the study seeks to explore the correlation between specific voice features and different stages or subtypes of Parkinson's disease, providing valuable insights into disease progression and variability. Moreover, by leveraging machine learning techniques, the research aims to develop a scalable and accessible diagnostic tool that can be deployed in diverse healthcare settings, facilitating early detection and personalized treatment plans for individuals at risk of or affected by PD. Furthermore, the study considers the potential integration of additional data modalities, such as clinical assessments or genetic markers, to enhance the predictive power and robustness of the diagnostic model. Ultimately, the goal is to contribute to the advancement of precision medicine approaches in neurodegenerative disorders, improving patient outcomes and quality of life.
Addressing the problem of utilizing voice recordings for Parkinson's disease diagnosis entails navigating several common limitations. Firstly, the size and diversity of the dataset pose significant challenges. Studies may encounter restricted sample sizes or lack diversity, hindering the ability to capture the full spectrum of Parkinson's manifestations accurately. This limitation can result in biased or less generalizable outcomes. Secondly, ensuring data quality and standardization across recordings is crucial yet complex. Variability in recording equipment, environmental factors, and speaker characteristics can affect the reliability and consistency of the data, potentially compromising the validity of the diagnostic model.
| Ref. No. | Data Source | Techniques Used | Best Model | Key Metrics |
|---|---|---|---|---|
| [7] | MDVP audio data | ML in telemedicine | Random Forest | 91.83% accuracy, 0.95 sensitivity |
| [8] | Non-motor symptoms | Boosted logistic regression | Boosted logistic regression | 97.159% accuracy, 98.9% ROC |
| [9] | Parkinson's Telemonitoring Voice Data Set from UCI | Deep neural networks, wavelet cleft fuzzy algorithm, firming bacteria foraging algorithm | Deep brooke inception net | 99.8% accuracy |
| [10] | Oxford Parkinson's Disease Detection Dataset | KNN, LR, RFC, XGBC | XGBoost Classifier | 96.7% accuracy, 0.8571 precision, 1.00 recall, 0.923 F1-score |
| [11] | UCI dataset | SVM, RF, DT, KNN, MLP with SMOTE and GridSearchCV | MLP | 98.31% accuracy, 98% recall, 100% precision, 99% f1-score |
| [12] | Voice features | Decision trees, Logistic regression, K-nearest neighbors, Ensemble learning | Not specified | Accuracies compared, focus on dysphonia detection |
| [13] | Speech and gait analysis data | Histogram of oriented gradients, Random forest classifier neural network | Random forest classifier | Predicts PD using patient datasets of drawings |
| [14] | Voice data | Feature selection (Boruta, RFE, RF) and classification (gradient boosting, XGBoost, bagging, Extra Tree) | Recursive feature elimination with bagging | 82.35% accuracy |
| [15] | Audio data | XGBoost | XGBoost | Higher accuracy in diagnosing PD from voice data |
| Dataset Information | |
|---|---|
| Attribute | Value |
| Number of instances | 195 |
| Area | Life |
| Attribute characteristics | Real |
| Number of attributes | 23 |
| Data donated | 26-6-2008 |
| Associated tasks | Classification |
| Missing values | N/A |
| File size | 39.7 KB |
| Voice sample attributes | Identifier | Name |
|---|---|---|
| Fundamental frequency | MDVP: Fo (Hz) | |
| MDVP: Fhi (Hz) | ||
| MDVP: Flo (Hz) | ||
| Frequency variation | MDVP: Jitter (%) | |
| MDVP: Jitter (Abs) | ||
| MDVP: RAP | ||
| MDVP: PPQ | ||
| MDVP: DDP | ||
| Amplitude variation | MDVP: Shimmer | |
| MDVP: Shimmer (dB) | ||
| Shimmer: (APQ3) | ||
| Shimmer: (APQ5) | ||
| MDVP: APQ | ||
| Shimmer: DDA | ||
| Noise and harmonics | NHR | |
| HNR | ||
| Health status | Status | |
| Complexity measures | RPDE | |
| D2 | ||
| Time series analysis | DFA | |
| Frequency variation (Nonlinear) | Spread 1 | |
| Spread 2 | ||
| PPE |
4. MATERIALS AND METHODS
4.1. Description of Dataset
The dataset was formulated through a partnership between Max Little from the University of Oxford and the National Centre for Voice and Speech in Denver, Colorado. These collaborators were responsible for recording the speech signals. The initial research detailed the techniques employed to extract features relevant to voice disorders in general. The details of dataset information and attributes are presented in Tables 1-3. These tables provide an overview of the dataset's composition, illustrating the diverse range of voice recording attributes collected from participants. This visualization is key to understanding the dataset's structure and the basis for our analysis. Figure delves into the attributes of the dataset, highlighting the specific features analyzed, such as acoustic properties, which are critical for distinguishing between healthy controls and Parkinson's disease patients. Also, these are fundamental to our methodology, showcasing the dataset's complexity and the analytical depth applied in our study.
4.2. Proposed Flow Diagram
The simplified flow diagram (Fig. 1) represents the process of data preparation and model evaluation in machine learning. It starts with creating variables, addressing label imbalances using imblearn's random oversampling, and then proceeds to data scaling through min-max and standard scaling techniques. Dimensionality reduction is achieved using PCA to retain 95% variance, followed by splitting the data into 80% for training and 20% for testing. The process culminates in fitting and evaluating various algorithms, including Logistic Regression, Random Forest, Decision Tree, SVM, kNN, Gaussian Naive Bayes, Bernoulli Naive Bayes, and a Voting Classifier, using metrics such as the confusion matrix, accuracy score, F1 score, precision score, and recall score. This streamlined approach encapsulates the essential steps in preparing data and evaluating machine learning models to ensure effective and efficient analysis.
4.3. Label Imbalance
The goal is to address label imbalance, where the number of instances labeled '1' (indicating individuals with Parkinson's) is significantly higher than instances labeled '0' (indicating individuals without Parkinson's). This imbalance can lead to skewed model performance. These classification tasks involve dependent variables with unique values (labels). For this case, there are two labels: '0' and '1'. The text highlights the issue of imbalance due to an unequal distribution of these labels in the dataset, with more '1's than '0's. This imbalance can mislead a machine learning model, making it more inclined to predict the majority class ('1') to achieve high accuracy, neglecting the patterns of the minority class ('0'). Here, the Python libraries, such as Matplotlib and Seaborn, are implemented to visualize and address this imbalance. It calculates the counts of '0's and '1's and creates a DataFrame for visualization, which is presented in Fig. (2). It explains how the DataFrame is structured and how a bar plot is used to visualize the label distribution, revealing the imbalance.
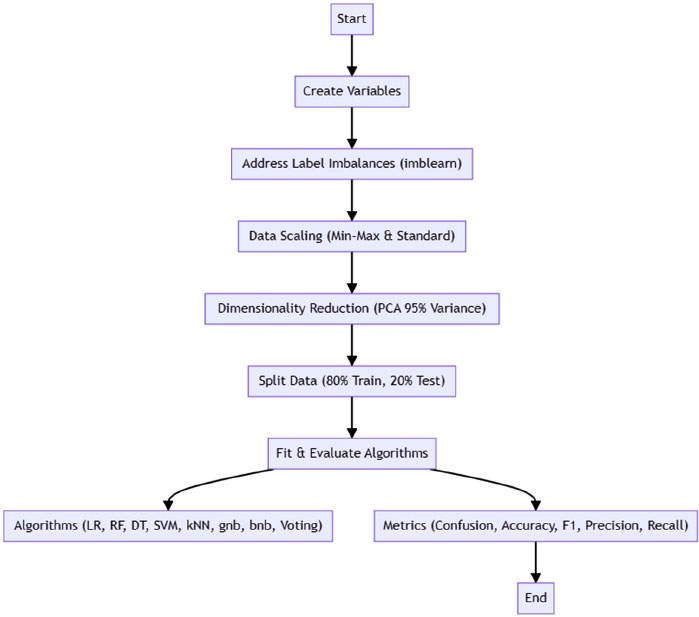 |
Fig. (1). Proposed flow diagram. |
 |
Fig. (2). Label imbalance. |
In addressing the imbalance problem in our dataset, we implemented a multifaceted approach to ensure the robustness and reliability of our machine-learning models. Firstly, we utilized the Synthetic Minority Over-sampling Technique (SMOTE) to artificially augment the underrepresented class in our dataset, thereby balancing the distribution between Parkinson's patients and healthy controls. Additionally, we applied under-sampling methods to reduce the size of the overrepresented class, further mitigating the imbalance issue. These steps were complemented by the use of ensemble learning techniques, specifically boosting and bagging, to enhance the models' ability to generalize from the balanced dataset. Each of these methods was carefully selected and optimized through cross-validation to ensure that the balance achieved contributed positively to the model's overall diagnostic accuracy and performance.
4.4. Distribution Analysis of Individual Attribute
The Python libraries like Matplotlib and Seaborn are employed to analyze the distribution of attributes in the dataset. It demonstrates distribution plots using Seaborn's function, illustrating them for individual columns and introducing a function for automating this process across all numerical columns. This underscores the importance of understanding normal distribution for machine learning. The Central Limit Theorem is mentioned, indicating that dataset samples should roughly adhere to normal distribution for algorithms to generalize well. In contrast, acknowledging that not all columns will perfectly match Gaussian curves. It is noted that most columns exhibit near-normal distribution with minor skewness, suggesting applicability for broader population representation. Some of the individual distribution is demonstrated in Fig. (3). This demonstrates the distribution analysis of various attributes, particularly focusing on MDVP (Mel-frequency cepstral coefficients) parameters, among others. This figure likely visualizes how these attributes are distributed across the dataset, highlighting any patterns of normality or skewness that are crucial for applying machine learning algorithms effectively.
 |
Fig. (3). Distribution analysis of attributes like various MDVP. |
In summary, the text delves into attribute distribution analysis, Purple Heart visualization, and automation using Python libraries. It emphasizes the significance of normal distribution for effective machine-learning algorithms and concludes by highlighting the close-to-normal distribution patterns observed across columns.
 |
Fig. (4). Box plot represents the outliers. |
4.5. Outlier Detection
This section focuses on the use of box plots, which follow the five-number summary (median, quartiles, minimum, and maximum), and is recommended to identify outliers. It illustrates the process of creating box plots for numerical columns using Python's Seaborn library. A function is employed to loop through and create box plots for applicable columns, excluding non-numeric ones like 'object' types and the 'ID' column. Outliers are identified on the plots, which are shown in Fig. (4). Further, it discusses the importance of verifying whether identified outliers are genuine anomalies or valid data points. It is noted that in some cases, the apparent outliers might be acceptable values based on the dataset's context. The more advanced outlier removal techniques like the IQR (Interquartile Range) method are implemented.
Additionally, it addresses correlation analysis using techniques like the heatmap representation. It also represents the outliers identified through box plots. Box plots are used to visually display the distribution of numerical data and identify outliers based on the five-number summary (minimum, first quartile, median, third quartile, and maximum). This figure helps in assessing the data's variability and the presence of potential anomalies that could influence the analysis.
4.6. Correlation of Dataset using Heatmap
This section focuses on explaining correlation and its impact on algorithms. Correlation is described as the measure of how changes in one set of data influence another set. Correlation is crucial for algorithms like
 |
Fig. (5). Implementation of heatmap to observe the correlation. |
 |
Fig. (6). Mind map diagram for data preparation and model evaluation. |
linear and logistic regression that develop mathematical models. The Fig. (5) illustrates the output of heatmaps to represent correlation visually. The aim is to identify a strong correlation between the dependent variable (status) and independent variables while avoiding high correlation among independent variables. Here, the Pearson's correlation method uses the heatmap function from Python's Seaborn library. Darker colors in the Fig. (6) indicate low correlation, while lighter colors represent high correlation. By observing the heatmap, the high correlations between independent variables are spotted and eliminated to avoid redundancy.
5. RESULTS
While preparing the data for the application of the algorithm, the initial focus is on creating dependent (Y) and independent (X) variables. Here, the dependent variable, “status,” is marked as Y, while X comprises all columns except “status” and “name,” which is an unnecessary ID column. Then, in the next step, addressing the label imbalances, which is implemented by the “imbalanced-learn” (imblearn) library, where random oversampling is recommended to maintain data integrity.
Additionally, the focus is given to scaling the data and reducing dimensionality using Principal Component Analysis (PCA). The scaling data is necessary to avoid overfitting and is achieved using methods like Min-Max Scaling or Standard Scaling library. Min-max scaling transforms data within a defined range, while Standard Scaling standardizes data by adjusting mean and standard deviation. Here, the Min-Max Scaling method is implemented, where data is scaled to fall between -1 and 1. It is noted that scaling is applied only to independent variables, not the dependent variable. Then feature engineering technique is realized to reduce data dimensionality and computational load. In this, the PCA method is applied, and the data is transformed to retain 95% of the variance. The transformed data has significantly fewer dimensions while preserving most of the original variance. The concluding phase includes the division of the data into training and testing subsets, allocating 80% for training purposes and the remaining 20% for testing the model's performance.
After several steps have been executed, label imbalance has been addressed, data has been scaled, feature engineering has been performed to reduce dimensions, and data has been split into training and testing sets. The focus now shifts to fitting the pre-processed data into algorithms to assess accuracy and performance. Rule-based algorithms such as logistic regression, random forest classifier, decision tree, support vector machine, KNN, gnb, bnb, and voting classifier are used in this work. Various metrics, including confusion matrix, accuracy score, F1 score, precision score, and recall score, will be employed to evaluate the models. The entire step flow is shown through a mind map diagram (Fig. 6).
As misclassifications have significant implications in healthcare and false positives and false negatives can impact patient health, therefore, performance will be measured comprehensively. A dataframe has been created to consolidate algorithm names, metrics, and accuracy scores. The dataframe is then visualized through a mind map diagram (Fig. 7) and bar chart (Fig. 8) to determine which algorithms perform better in terms of accuracy. However, true positive and false positive rates are crucial, prompting further evaluation to ensure reliable predictions.
5.1. Model Evaluation using XGBoost Classifiers
In this phase, the focus is on model evaluation using the XGBoost classifier. The process involves calling the confusion matrix, F1 score, and classification report metrics for both the original and extra boosting models. These metrics provide insights into the performance of the classifiers, emphasizing the importance of true positive and true negative rates in healthcare applications.
The main goal is to loop through the list of trained models and apply the evaluation process systematically. By iterating through the list, each model is individually evaluated using the metrics discussed. This approach ensures a comprehensive assessment of various algorithms, and classification reports along with confusion matrices are shown in Fig. (9) for each model. This detailed evaluation allows for a comparison of model performance and assists in identifying the algorithm that best suits the task.
 |
Fig. (7). Visualization of algorithm accuracy. |
 |
Fig. (8). Model evaluation through bar chart. |
5.2. Model Evaluation through ROC
The ROC (Receiver Operating Characteristic) provides insight into a model's performance. It generates a plot depicting the relationship between the true positive rate and the false positive rate. A line on this graph represents the point where the positive rate is equivalent to the false positive rate. Curves above this line indicate model predictions. The closer a curve is to this line, the poorer the model performs; the farther it is, the better the model. The area under this curve is termed the “area under the receiver operating characteristic curve” or AUC. The speaker explained the process of plotting the ROC using existing methods in the Escalon library, specifically mentioning methods like Orosco and U.S. These are utilized to determine confusing metrics. By importing these methods and finding the model's predicted probabilities, one can derive predictions. These predictions, along with the actual output, are fed into the Orosco method to obtain values like false positives, true positive rates, and threshold values. The AUC is then determined using these values. The matplotlib is implemented to visualize the ROC, set titles and plot values. Again, this process is encapsulated into a function, which is then iterated over different models using the same method realized earlier. The intention is to plot the ROC for each model and print the algorithm's name. This visualization helps in determining which model performs best based on the ROC, which is presented in Fig. (10). The ROC curve is a graphical representation that illustrates the diagnostic ability of a binary classifier system as its discrimination threshold is varied. It plots the True Positive Rate (TPR) against the False Positive Rate (FPR) at various threshold settings. The closer the ROC curve is to the top left corner, the higher the model's overall accuracy. The area under the ROC curve (AUC) provides a single measure of overall model performance across all classification thresholds, with a larger area indicating better performance. Fig. (9) aims to compare the efficacy of different models in distinguishing between Parkinson's disease patients and healthy controls, highlighting which models perform best in terms of sensitivity (true positive rate) and specificity (1 - false positive rate). The detailed explanation alongside Fig. (10) emphasizes the importance of ROC analysis in evaluating and selecting the most effective model for Parkinson's detection based on the model's ability to balance sensitivity and specificity, crucial factors in medical diagnostics.
6. DISCUSSION
The evaluation of various machine learning models for Parkinson's detection is discussed. After preprocessing the data and fitting it into different models, the focus shifted to determining the best-performing model based on various metrics.
The ROC (Receiver Operating Characteristic) was emphasized as a crucial evaluation tool. It graphs the true positive rate in relation to the false positive rate. Models were evaluated based on accuracy, with logistic regression performing poorly at 72.88%. Other algorithms like random forest (using information gain and entropy rule), SVM, and KNN showed better results. However, models like the naive Bayes didn't perform as well, despite their mathematical advantages. For a medical project like Parkinson's detection, accuracy isn't the sole evaluation criterion. The true positive, false positive, false negative and true negative values are equally significant. So, the importance of the confusion matrix and the F1 score in evaluating models is highlighted.
 |
Fig. (9). Classification report for all algorithms, including confusion matrix. |
 |
Fig. (10). Evaluation of models through ROC. |
Upon comparison, the K Nearest Neighbors (KNN) classifier stood out. It not only had commendable accuracy but also reported zero false positives and negatives. This makes it especially reliable for detecting Parkinson's, as false negatives (missing a positive case) can have serious implications. A perfect AUC score of one might indicate overfitting, which isn't ideal. However, the KNN model's performance was consistent across all metrics, making it the top choice for this detection process.
CONCLUSION
Parkinson's disease, a debilitating neurodegenerative disorder, necessitates timely and precise detection to enhance patient outcomes. This study endeavors to harness voice recordings, a novel approach, underscores the potential of non-invasive techniques in medical diagnostics. Through rigorous analysis of a dataset with 195 instances and 23 attributes, the research delved deep into the capabilities of various machine learning algorithms. While some models, like logistic regression, fell short in terms of accuracy, others, notably the K Nearest Neighbors (KNN) classifier, showcased exemplary performance. The emphasis wasn't merely on accuracy; the study recognized the paramount importance of metrics like the confusion matrix and the F1 score, especially in a medical context where false negatives could lead to grave consequences. The KNN model's unparalleled ability to report zero false positives and negatives, combined with its consistent performance across all evaluation metrics, solidifies its position as the most suitable choice for this endeavor. However, it's crucial to approach the perfect AUC score with caution, as it might hint at overfitting. In conclusion, this research illuminates the potential of machine learning in revolutionizing Parkinson's detection, with the KNN model emerging as a beacon of hope for early and accurate diagnosis.
In light of the promising results obtained from our current research on detecting Parkinson's Disease through voice analysis, future studies will aim to expand on several key areas. Firstly, we plan to enrich our dataset by incorporating a wider variety of voice samples, including those from early-stage Parkinson's patients, to enhance the model's diagnostic capabilities. Secondly, exploring advanced machine learning algorithms and deep learning techniques will be prioritized to improve the accuracy and reliability of Parkinson's detection further. Additionally, integrating our model into mobile applications or telehealth platforms represents a significant next step towards practical, real-world application, offering more accessible diagnostic tools for early detection. Collaborative efforts with neurologists and other medical professionals will also be essential in validating and refining our approach, ensuring it aligns with clinical needs and enhances patient care. Lastly, investigating the model's ability to monitor disease progression and response to treatment could provide valuable insights for personalized patient management strategies.
LIST OF ABBREVIATIONS
| PD | = Parkinson's Disease |
| ML | = Machine Learning |
| LDA | = Linear Discriminant Analysis |
| SVM | = Support Vector Machine |
| KNN | = K-Nearest Neighbors |
| SMOTE | = Synthetic Minority Over-sampling Technique |
| PCA | = Principal Component Analysis |
ETHICS APPROVAL AND CONSENT TO PARTICIPATE
Not applicable.
HUMAN AND ANIMAL RIGHTS
No animals/humans were used in this research.
CONSENT FOR PUBLICATION
Not applicable.
AVAILABILITY OF DATA AND MATERIALS
The data and supportive information are available within the article.
FUNDING
None.
CONFLICT OF INTEREST
The authors declare no conflict of interest, financial or otherwise.
ACKNOWLEDGEMENTS
Declared none.